The East Siberian Arctic Shelf holds large amounts of inundated carbon and methane (CH4). Holocene warming by overlying seawater, recently fortified by anthropogenic warming, has caused thawing of the underlying subsea permafrost. Despite extensive observations of elevated seawater CH4 in the past decades, relative contributions from different subsea compartments such as early diagenesis, subsea permafrost, methane hydrates, and underlying thermogenic/ free gas to these methane releases remain elusive. Dissolved methane concentrations observed in the Laptev Sea ranged from 3 to 1,500 nM (median 151 nM; oversaturation by ∼3,800%). Methane stable isotopic composition showed strong vertical and horizontal gradients with source signatures for two seepage areas of δ13C-CH4 = (−42.6 ± 0.5)/(−55.0 ± 0.5) ‰ and δD-CH4 = (−136.8 ± 8.0)/(−158.1 ± 5.5) ‰, suggesting a thermogenic/natural gas source. Increasingly enriched δ13C-CH4 and δD-CH4 at distance from the seeps indicated methane oxidation. The Δ14C-CH4 signal was strongly depleted (i.e., old) near the seeps (−993 ± 19/−1050 ± 89‰). Hence, all three isotope systems are consistent with methane release from an old, deep, and likely thermogenic pool to the outer Laptev Sea. This knowledge of what subsea sources are contributing to the observed methane release is a prerequisite to predictions on how these emissions will increase over coming decades and centuries.
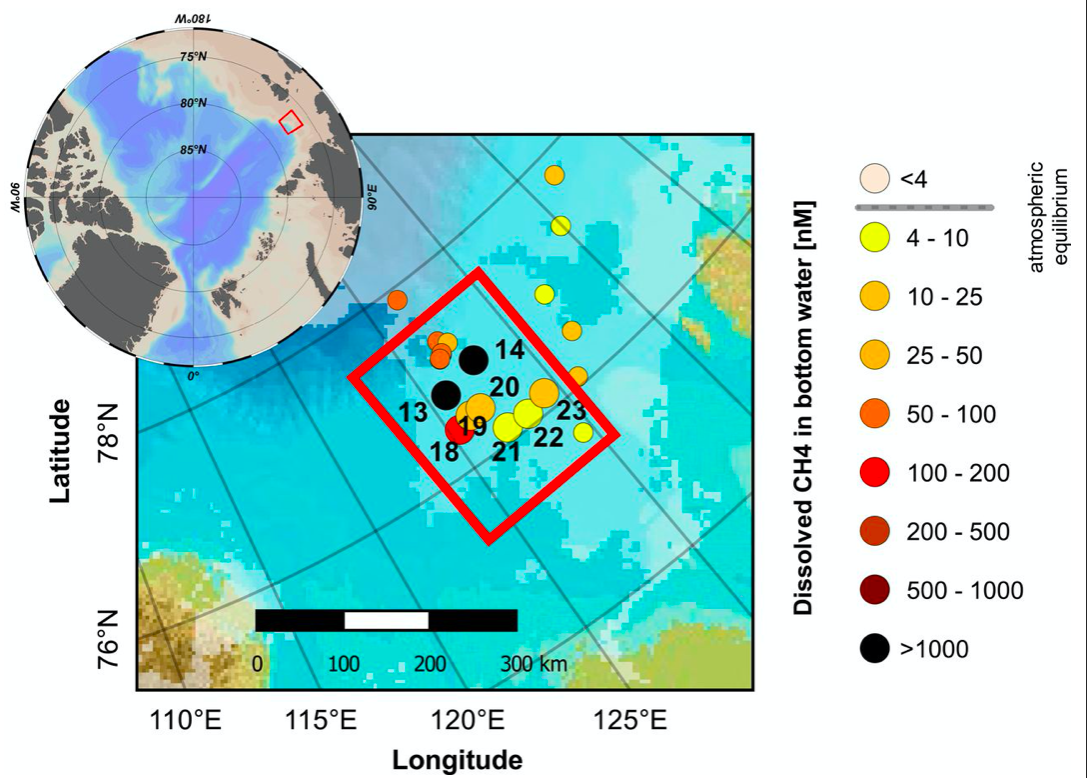
The study area and sampling locations for CH4 concentration and isotopes. The colored dots show the locations of samples taken in the northern Laptev Sea during the SWERUS-C3 2014 expedition, with the colors representing concentration of dissolved CH4 in bottom water (sampling depth ca. 5 m above bottom). The subset of sampling stations that were used for this study is highlighted with larger symbols and station numbers.
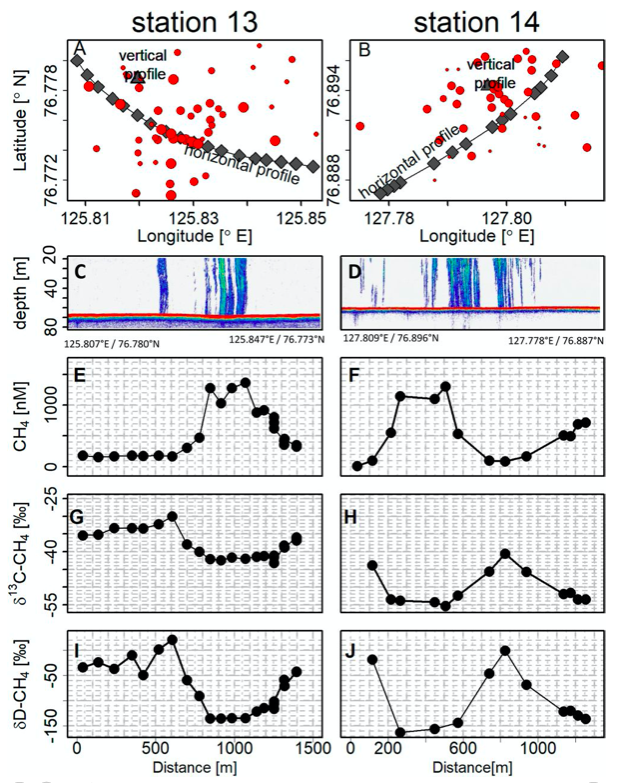
The horizontal bottom water profiles and distribution of gas seeps. Data from bottom waters and distribution of gas seeps around hotspots at stations 13 (left column) and 14 (right column). Row 1 (A and B) shows sampling locations for vertical (triangles) and horizontal (diamonds) profiles and locations of gas seeps (red dots) as identified by midwater echosounder. The dot size is proportional to observed seep size by the echosounder. (C–J) Horizontal data, plotted versus distance from the start of the transect (see start and end coordinates in the respective column). Row 2 (C and D) shows water column echosounder data along the drift, row 3 (E and F) shows concentration of dissolved CH4, row 4 (G and H) shows δ13C-CH4, and row 5 (I and J) shows δD-CH4 from Niskin bottles. Average sampling depth is ∼5 m above sea bottom; water depths are 68 m for station 13 and 61 m for station 14.
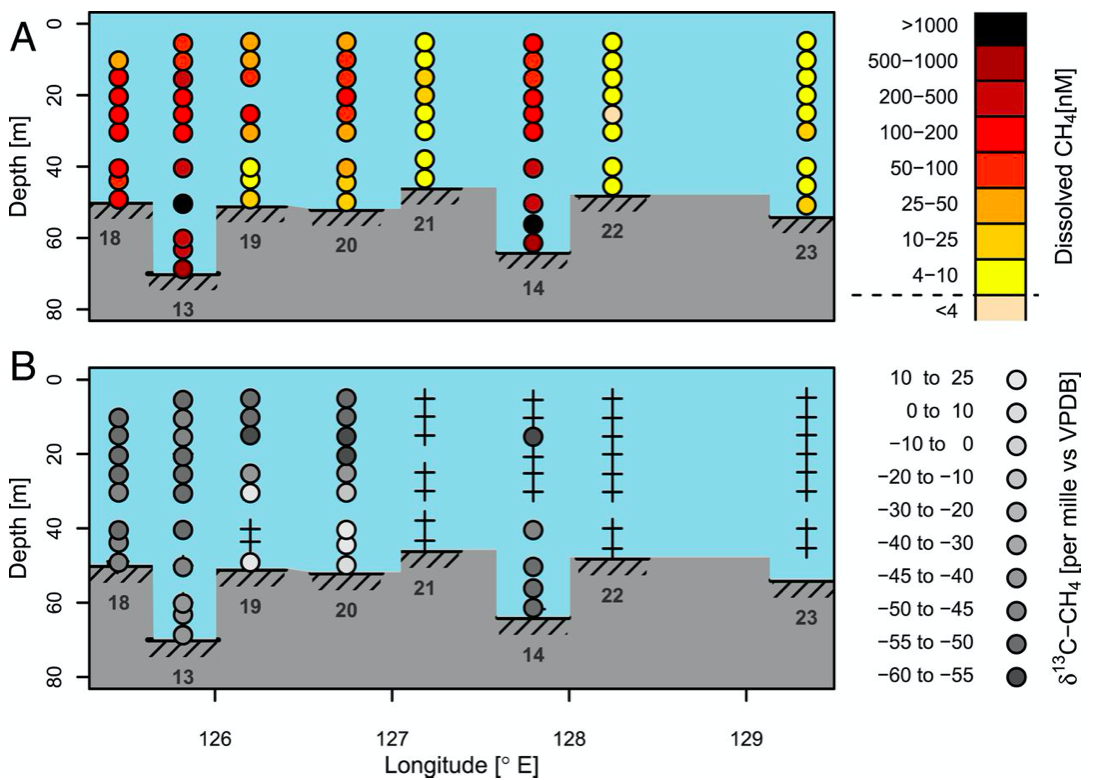
Vertical water column profiles. (A) Dissolved CH4 concentration. (B) δ13C-CH4. The dashed line at the concentration value of 4 nM in the legend of A indicates the dissolved CH4 concentration corresponding to equilibrium with the overlying atmosphere. The crosses in B illustrate locations where samples have been taken but no δ13C-CH4 analysis was performed. The inserted numbers below each profile denote the station number.
The published article can be found here.